Documentation Index

Fetch the complete documentation index at: https://docs.kreo.app/llms.txt

Use this file to discover all available pages before exploring further.

Trade up/down crypto markets with ease, through our new mini-app. A sleek addition to help you perform better.
Screenshot 2026 04 22 At 4 13 43 PM
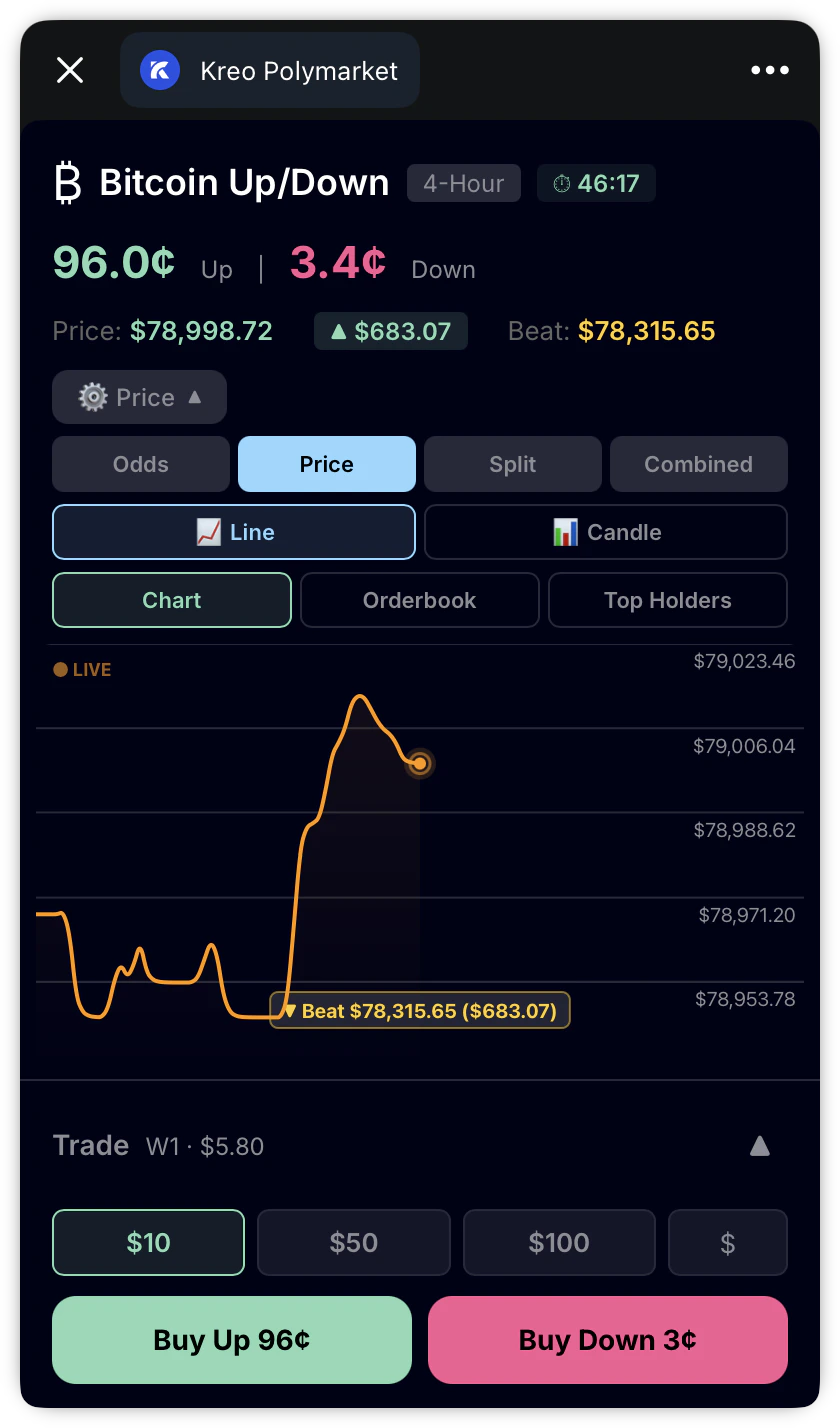
Our charts have lower latency than any other user interface. You can view marks on the charts to see copytrade notifications, where you bought and sold, and your real-time PNL.

How do I access Charts?

1

Navigate to Crypto Up/down market

2

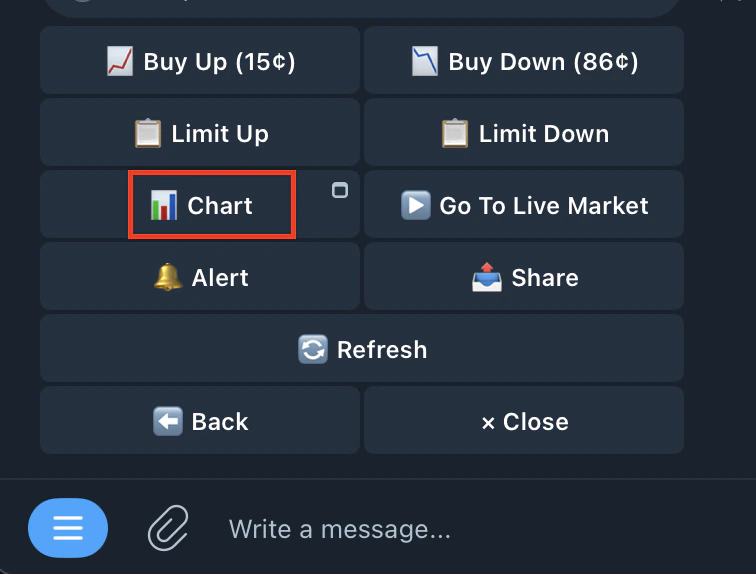
Tap Charts to open the mini-app
Screenshot 2026 04 18 At 4 31 34 AM
3

View Chart and Start Trading!


What can I do with Charts?

Buy & Sell

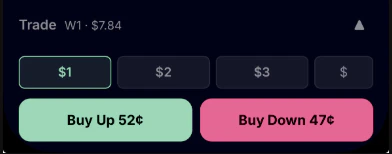
Set a Buy Amount, either using one of the presets from your Kreo Telegram Bot, or a custom buy amount - and press buy to be filled in directly on the chart.
Screenshot2026 03 30at01 04 34
Screenshot 2026 04 22 At 4 39 17 PM
ButtonsFunction
OddsView the live odds chart for the market
PriceView the live crypto price chart
SplitView odds and price charts side by side
CombinedView both price and odds overlaid on one chart
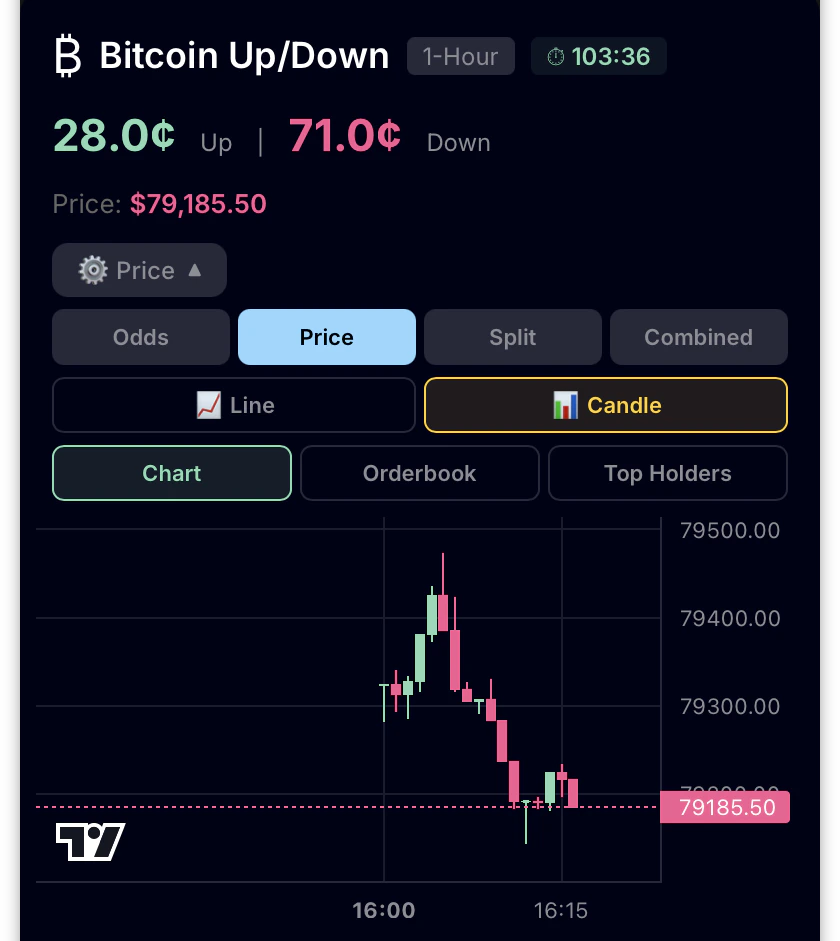
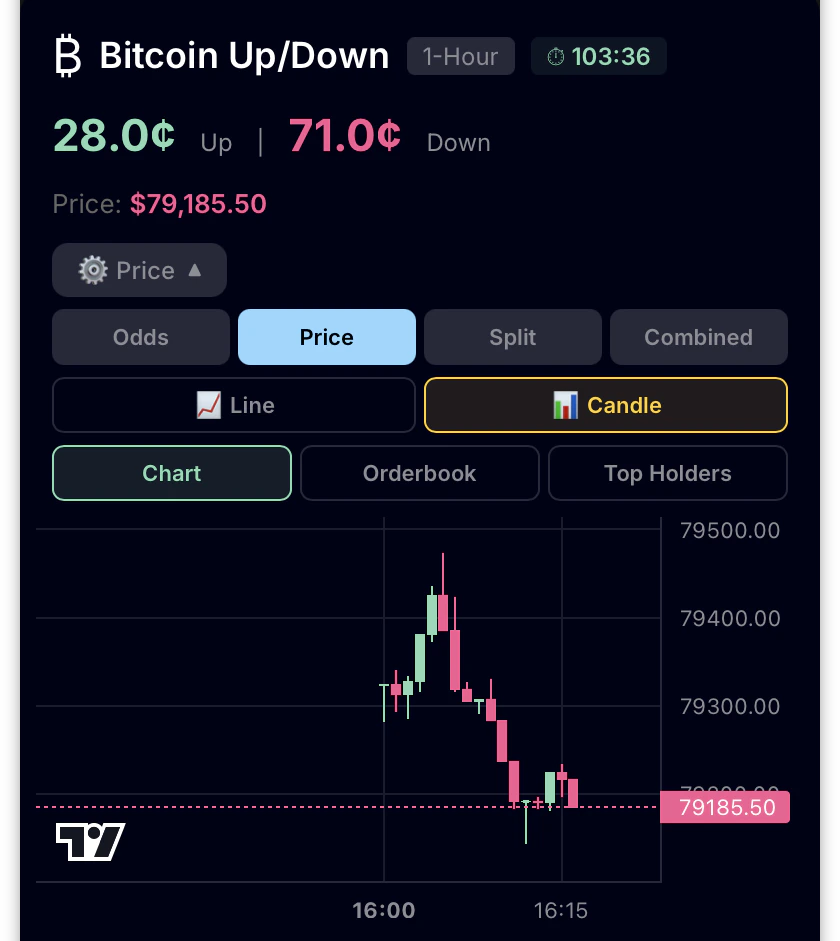
📈 LineThe Line view displays the crypto price as a continuous orange line over time
📊 CandleThe Candle view displays the crypto price as traditional candlestick charts
ChartMain chart view with all chart options
OrderbookView the live orderbook to see bid/ask depth and where the market is heading. Useful for understanding liquidity and price direction
Top HoldersView the top 50 holders on the current crypto up/down market

Chart Markers
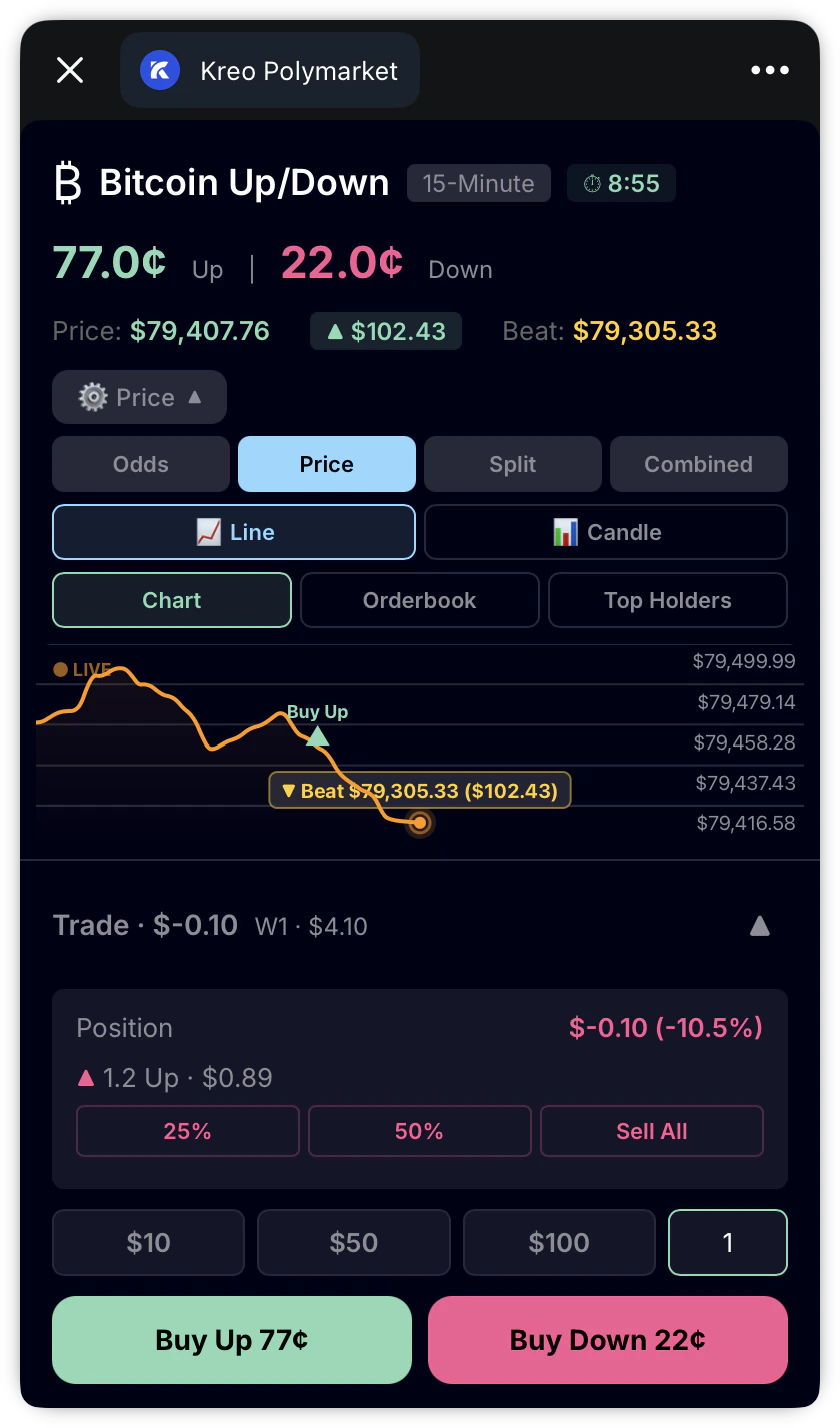
Markers are visual indicators that appear directly on the price chart to show you important events at the exact moment they happened.
Screenshot 2026 04 22 At 5 06 06 PM
MarkerWhat it shows
Copy Trade NotificationsMarks where a leader you’re copying placed a trade
Buy & Sell PointsMarks your exact entry and exit points on the chart so you can see your trades in context of price movement